
Future demand for senior housing is complicated to predict, especially with incoming baby boomers redefining the market as we know it. However, national demographics data* have uncovered some surprising foresight about your future residents.
What do your future residents look like?
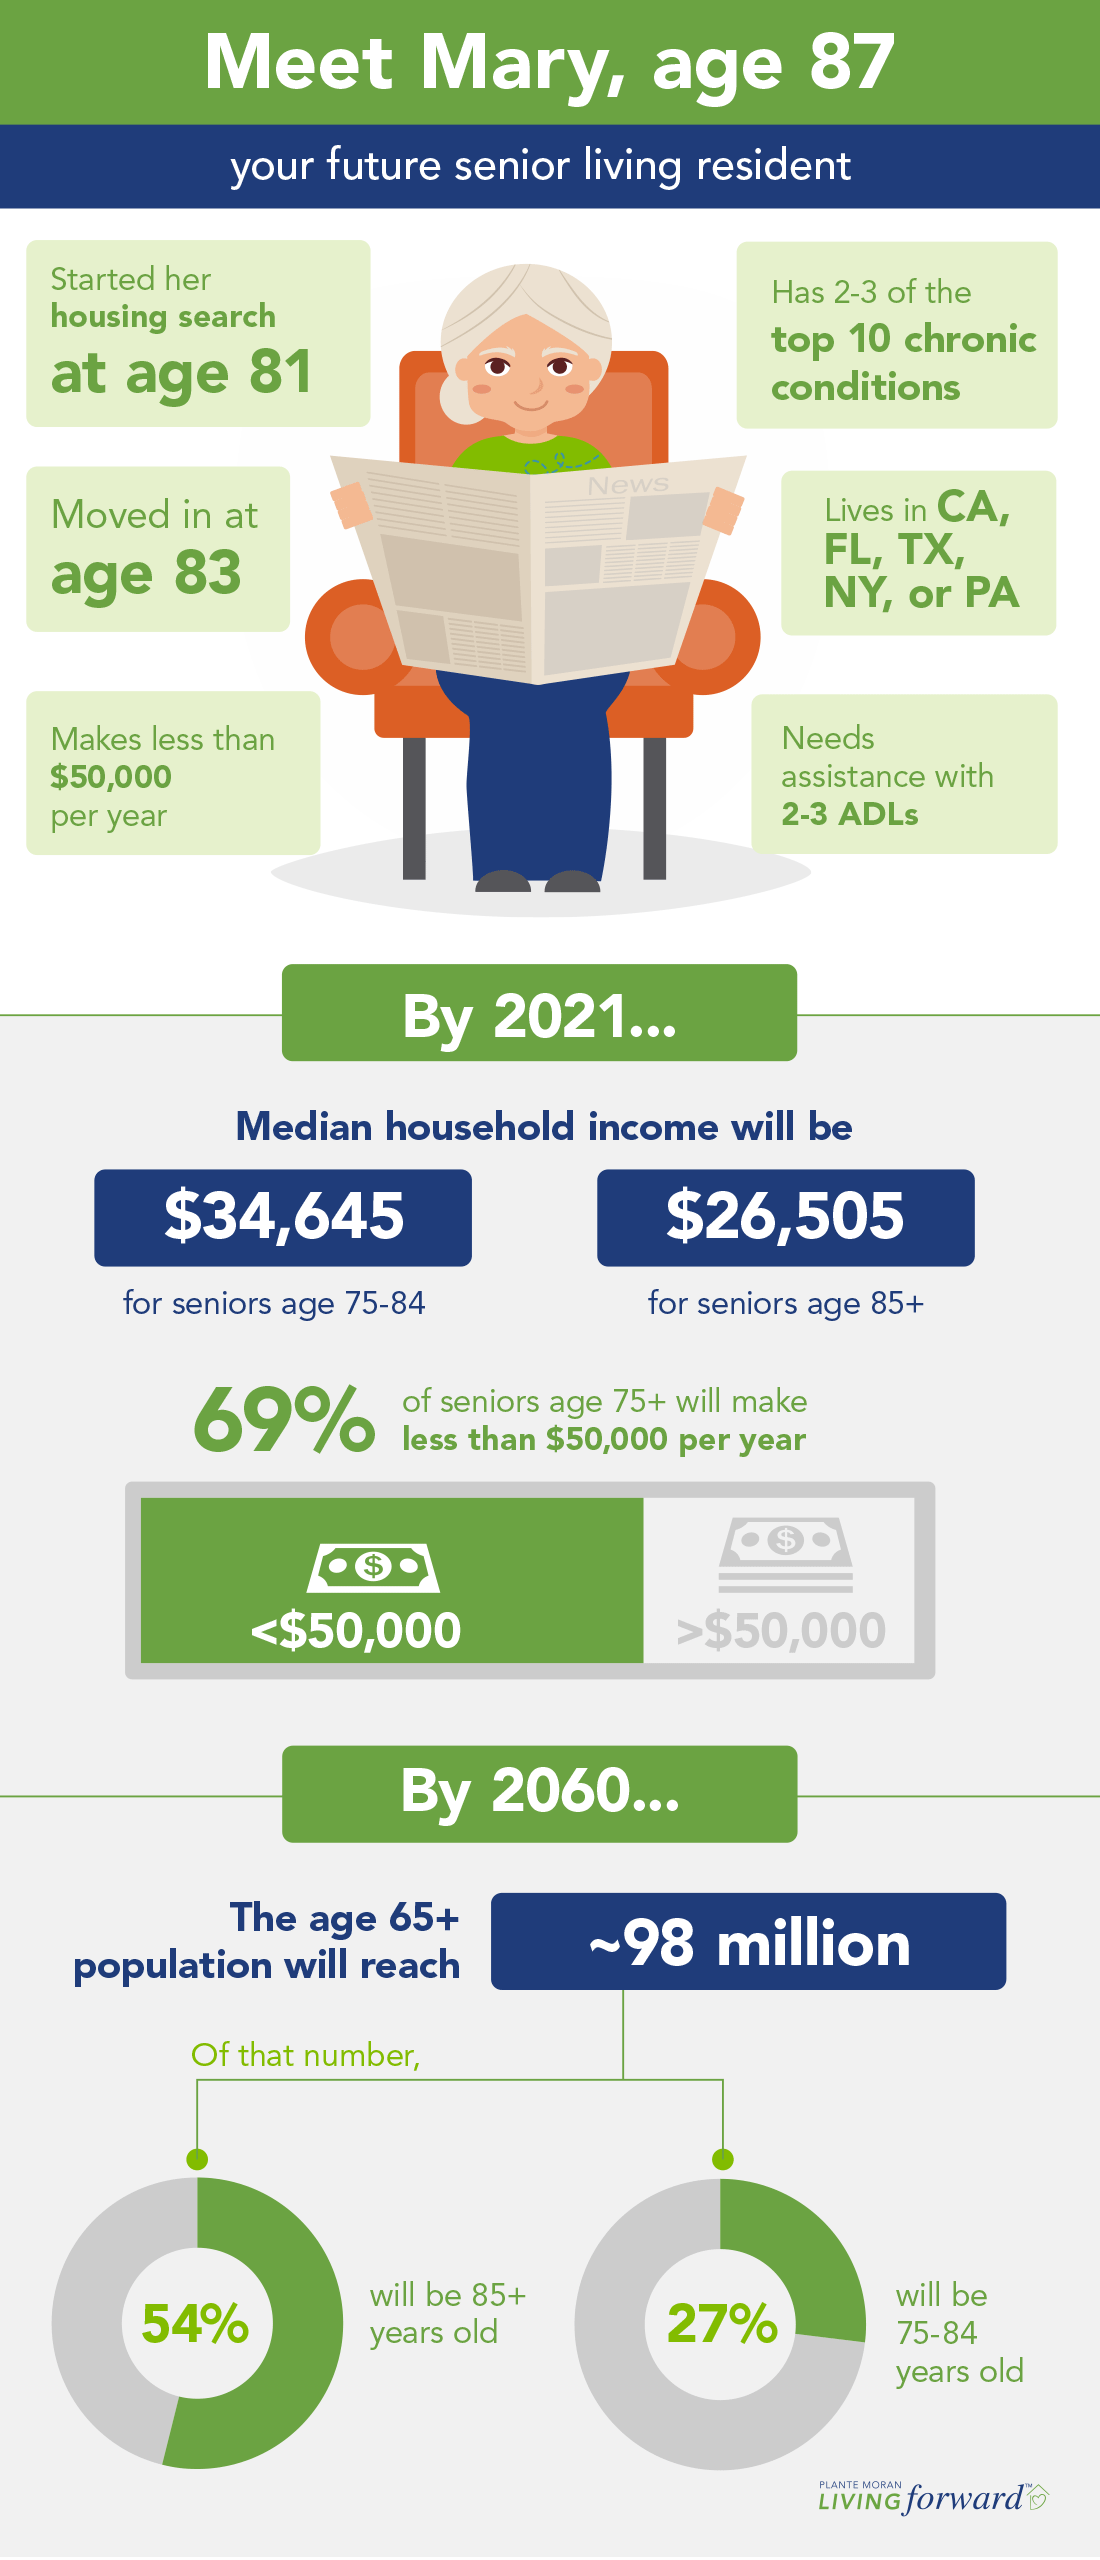
Every developer, owner, operator, sales rep, dietary technician, and nurse is aware that the United States’ senior population is growing at an accelerated rate. Our current 48 million seniors age 65 years or older will, by 2060, reach almost 98 million. Even in just the next five years, the age 65 and older senior population will grow around 17.5 percent.
Yet despite this exponential rise in our target age group during the coming years, we can’t necessarily expect demand for our communities to rise along with it.
With the increase of amenities and disability adaptation options in today’s homes, the convenience of direct delivery for a variety of goods and services, and the growing means of alternative transportation (think: Lyft), it should come as no surprise that a desire to age in place is on the rise. Nearly 90 percent of seniors report that they would prefer to age in their current community or residence for as long as possible, a significant upward shift over the last 10 years.
According to data aggregated by our team, the preference to age in place is changing the demographic of seniors entering senior living communities:
- The average age of a senior looking for care is 81, while the average age of a senior at the time of move-in is 83.
- Approximately 54 percent of residents are 85 years or older, and 27 percent are between 75 and 84 years old.
- The typical resident is an 87-year-old woman in assisted living who needs help with two to three ADLs (activities of daily living).
- The typical resident will have up to two or three of the top 10 chronic conditions.
These age and population statistics indicate that seniors are coming into senior living communities older and in need of more assistance than ever before. We expect the percentage of higher acuity residents entering senior living communities to continue to increase as seniors postpone moving out of their homes.
Where do your future residents live?
Having a long view of population trends is helpful, but let’s focus a bit on the near future as we delve into where our target senior population is aging. Large concentrations of senior households in a single geographic area could indicate a rise in demand for senior living.
Since we know 81 is the average age most seniors begin looking at senior living communities, let’s uncover more targeted information about your future resident by segmenting our geographic data to look specifically at the 75 and older crowd who will likely be considering your community within the next five to 10 years.
U.S. Households Age 75+ by State in 2021
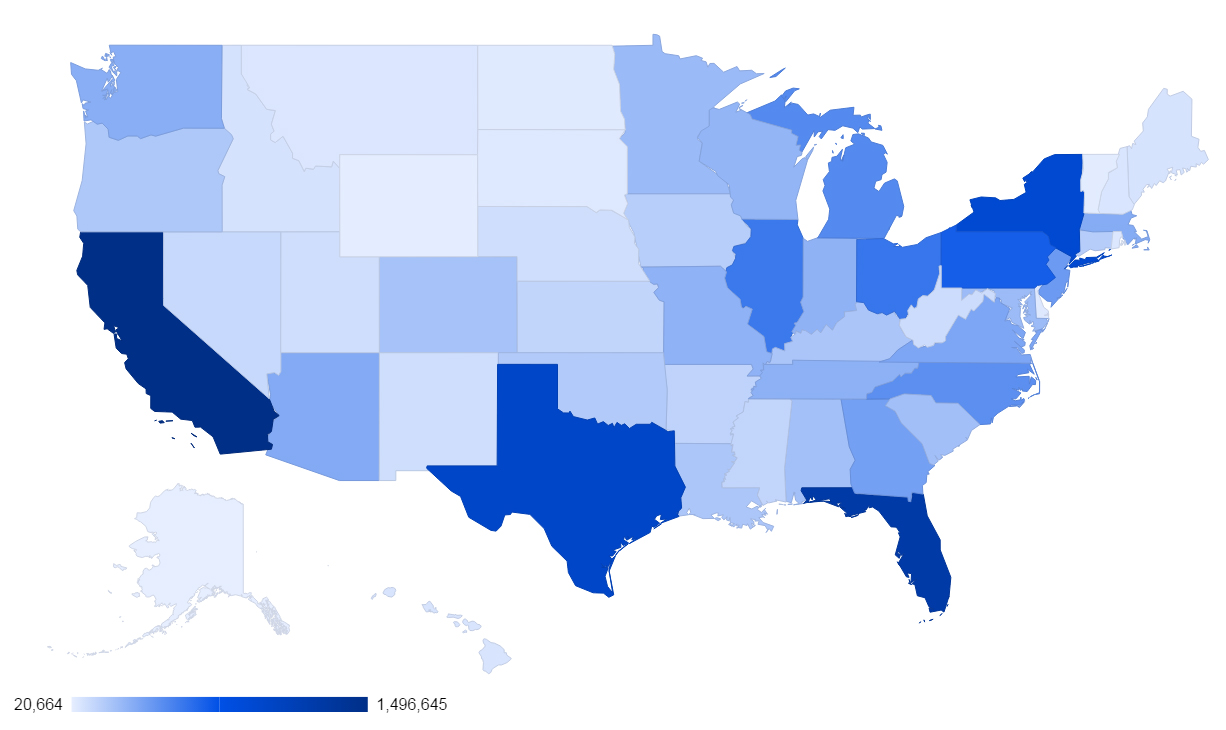
The U.S. map above shows the distribution of households age 75 and older in 2021.
California (10.15 percent), Florida (8.49 percent), Texas (6.73 percent), New York (6.26 percent), and Pennsylvania (4.69 percent) rank as the top five states for households of seniors age 75 and older in 2021. At the low end of the spectrum, you have Alaska, Wyoming, the District of Columbia, Vermont, and North Dakota. These states combine to account for only 1.02 percent of the senior households in 2021.
The Midwest** accounts for 15 percent of total senior households in 2021, which translates to about 2.2 million senior households.
Senior population density can offer insight into potential demand, but it isn’t the only factor to consider when comparing regions, states, or MSAs for future growth. Operators will need to decide if the type of resident living in those areas meets their resident profile and if these markets are being adequately served with existing product.
What are your future residents’ financial realities?
Consider this: In 2021, nearly 69 percent of U.S. seniors age 75 and older will earn $50,000 or less each year. The median household income will be $34,645 for those age 75 to 84 and just $26,505 for those 85 and older.
Seniors in this age range may be considering senior living, but what they can afford based on their income is quite divided.
Looking at the 75 years and older demographic who may be considering moving into a senior living community in 2021, the estimated income levels break down roughly into thirds:
2021 Household Income, Households Age 75+
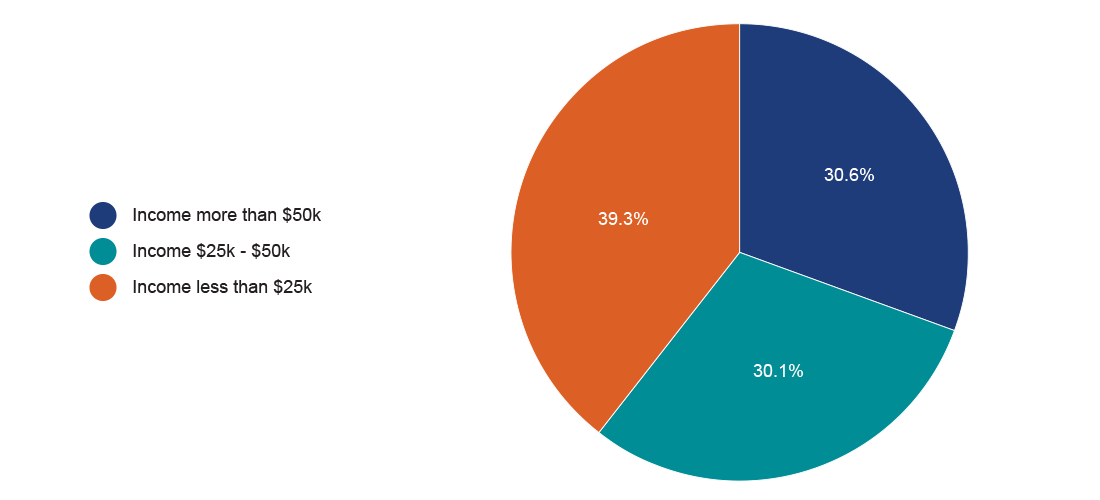
- About 31 percent fall into the high-income market. They will earn more than $50,000 per year.
- About 30 percent fall into the middle-income market. They will earn between $25,000 and $50,000.
- About 39 percent fall into the low-income market. They will earn less than $25,000 per year.
In addition, most seniors in this age range will have already begun drawing on their retirement funds to supplement their income as they age in their current residence.
Contrast these numbers with the average yearly costs of a stay at your community. How do your target customers’ available funds compare?
They’re probably within range of U.S. averages, which indicate that residents spend about $60,500 per year for independent living ($53,740 in the Midwest) and $62,880 for assisted living ($61,694 in the Midwest). The costs are expected to increase from there.
The deficit between income and cost is hard to bridge, although those on the lower end of the income spectrum may qualify for government subsidized programs that could help alleviate the cost burden.
To make senior housing and care affordable for the middle-income market — those who don’t qualify for aid but also don’t make enough to pay for senior living — providers are going to have to think creatively about how to build and operate senior living communities that are affordable.
Meet your future resident
Curious about what your future residents might look like when they’re ready to move in? Based on the demographics data, it’s likely they will look something like our friend Mary:
*Data for this blog post aggregated from the National Investment Center for Seniors Housing & Care (NIC), The National Center for Assisted Living, the United States Social Security Administration, Centers for Disease Control and Prevention, and A Place for Mom. Although obtained from sources deemed reliable, no warranty or representation, expressed or implied, is made as to the accuracy of the information herein. This data is for informational use only.
**The Midwest, as defined in this post, refers to the states of Wisconsin, Illinois, Michigan, Indiana, and Ohio.


