
Opportunities abound as we look to the future of the senior living industry. By 2030, households with seniors age 85+ are expected to increase by 100% percent or more in some states. Even with aging at home the preferred option for nine out of 10 seniors, this kind of population increase portends a healthy outlook for senior living development.
However, with overbuilding a concern, where should you open your next senior living facility? A look at demographics data and market metrics across the United States uncovers three surprising markets you might consider for your next senior living development.
Where should you build your next senior living facility?
Our search for the most favorable markets for senior living development starts with the question, “Which states will see the most growth in senior households?” Large increases in a senior population in a single geographic area could indicate there will be a rise in demand for senior living, making this a good way to narrow down the number of markets we will assess further.
The hexagon chart below describes the growth in 85+ households from 2015 to 2030. Green states have larger-than-average growth rates for this population, red states have lower-than-average.
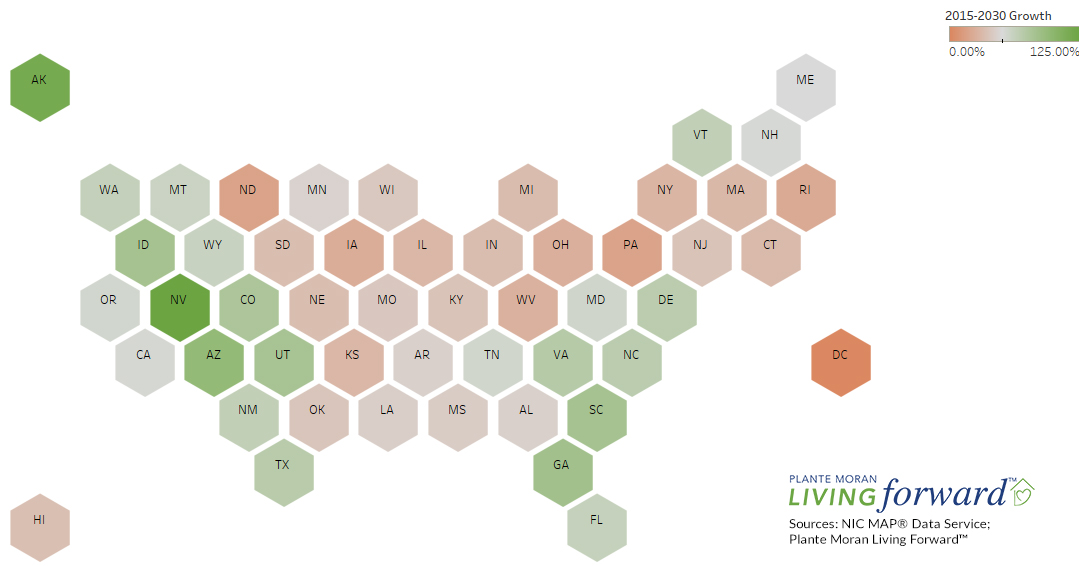
The data show these 12 states will see the most senior household aged 85+ growth:
- Nevada, which is expecting a 125% increase
- Alaska, which is expecting a 117% increase
- Arizona, which is expecting a 95% increase
- Georgia, which is expecting a 85% increase
- Idaho, which is expecting a 82% increase
- South Carolina, which is expecting a 82% increase
- Utah, which is expecting a 81% increase
- Colorado, which is expecting a 77% increase
- Virginia, which is expecting a 71% increase
- Texas, which is expecting a 70% increase
- Delaware, which is expecting a 68% increase
- North Carolina, which is expecting a 68% increase
As you can expect, the projected growth in senior households is unevenly dispersed across the United States. Most of the impressive population increases will happen in the west and south. While that doesn’t mean opportunities won’t exist in the north and east, it does make the west and south of interest to providers looking to expand their reach in the coming years.
Which markets show demand for senior living development?
Population increase — especially when measured on a large, statewide scale — is only a place to begin understanding where there may be need for senior living. Next, we assess the metropolitan statistical areas (MSAs) within those high-growth states to look for metrics that more strongly indicate demand for senior living development.
To rank the MSAs, we used weighted scores for metrics that indicate favorable penetration, activity, and performance.
Penetration rates help measure the degree to which a market is either underserved or saturated. These rates calculate the percentage of the qualified market that must be captured to achieve stabilized occupancy.
Relative to benchmarks, a low penetration rate indicates potential for increased supply in the market area. Relatively high penetration rates indicate little potential, or a surplus of inventory in the market area. As penetration rates increase, units may become more difficult to fill.
However, higher penetration rates are not always indicative of saturated markets. It is important to consider penetration rates in combination with other indicators of market potential. That’s why we must also look at metrics indicating market activity and performance.
Our activity category takes into account the amount of construction in the market. MSAs with more development in the pipeline tend to be prohibitive to new development. The performance category, on the other hand, looks at the existing supply, assessing the MSAs average property age and occupancy levels. Older properties and higher occupancies are what we look for to assess performance, since these factors could signal a need for more units.
Based on this analysis, 10 markets stand out as possibilities for new senior living development in 2019.
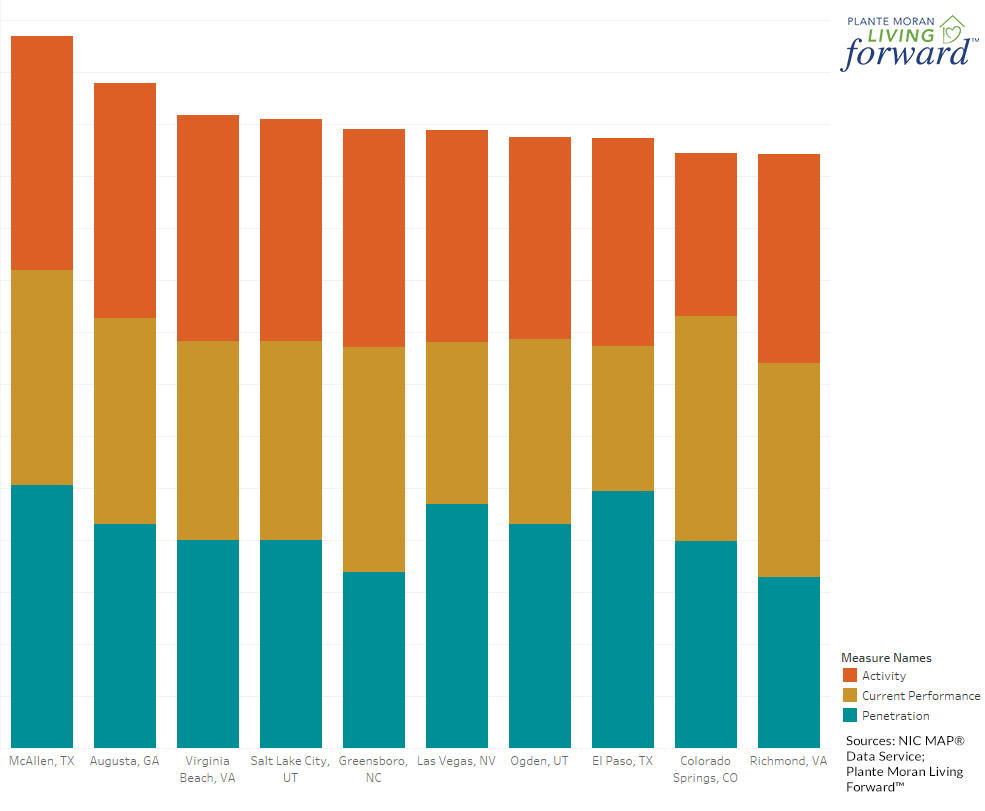
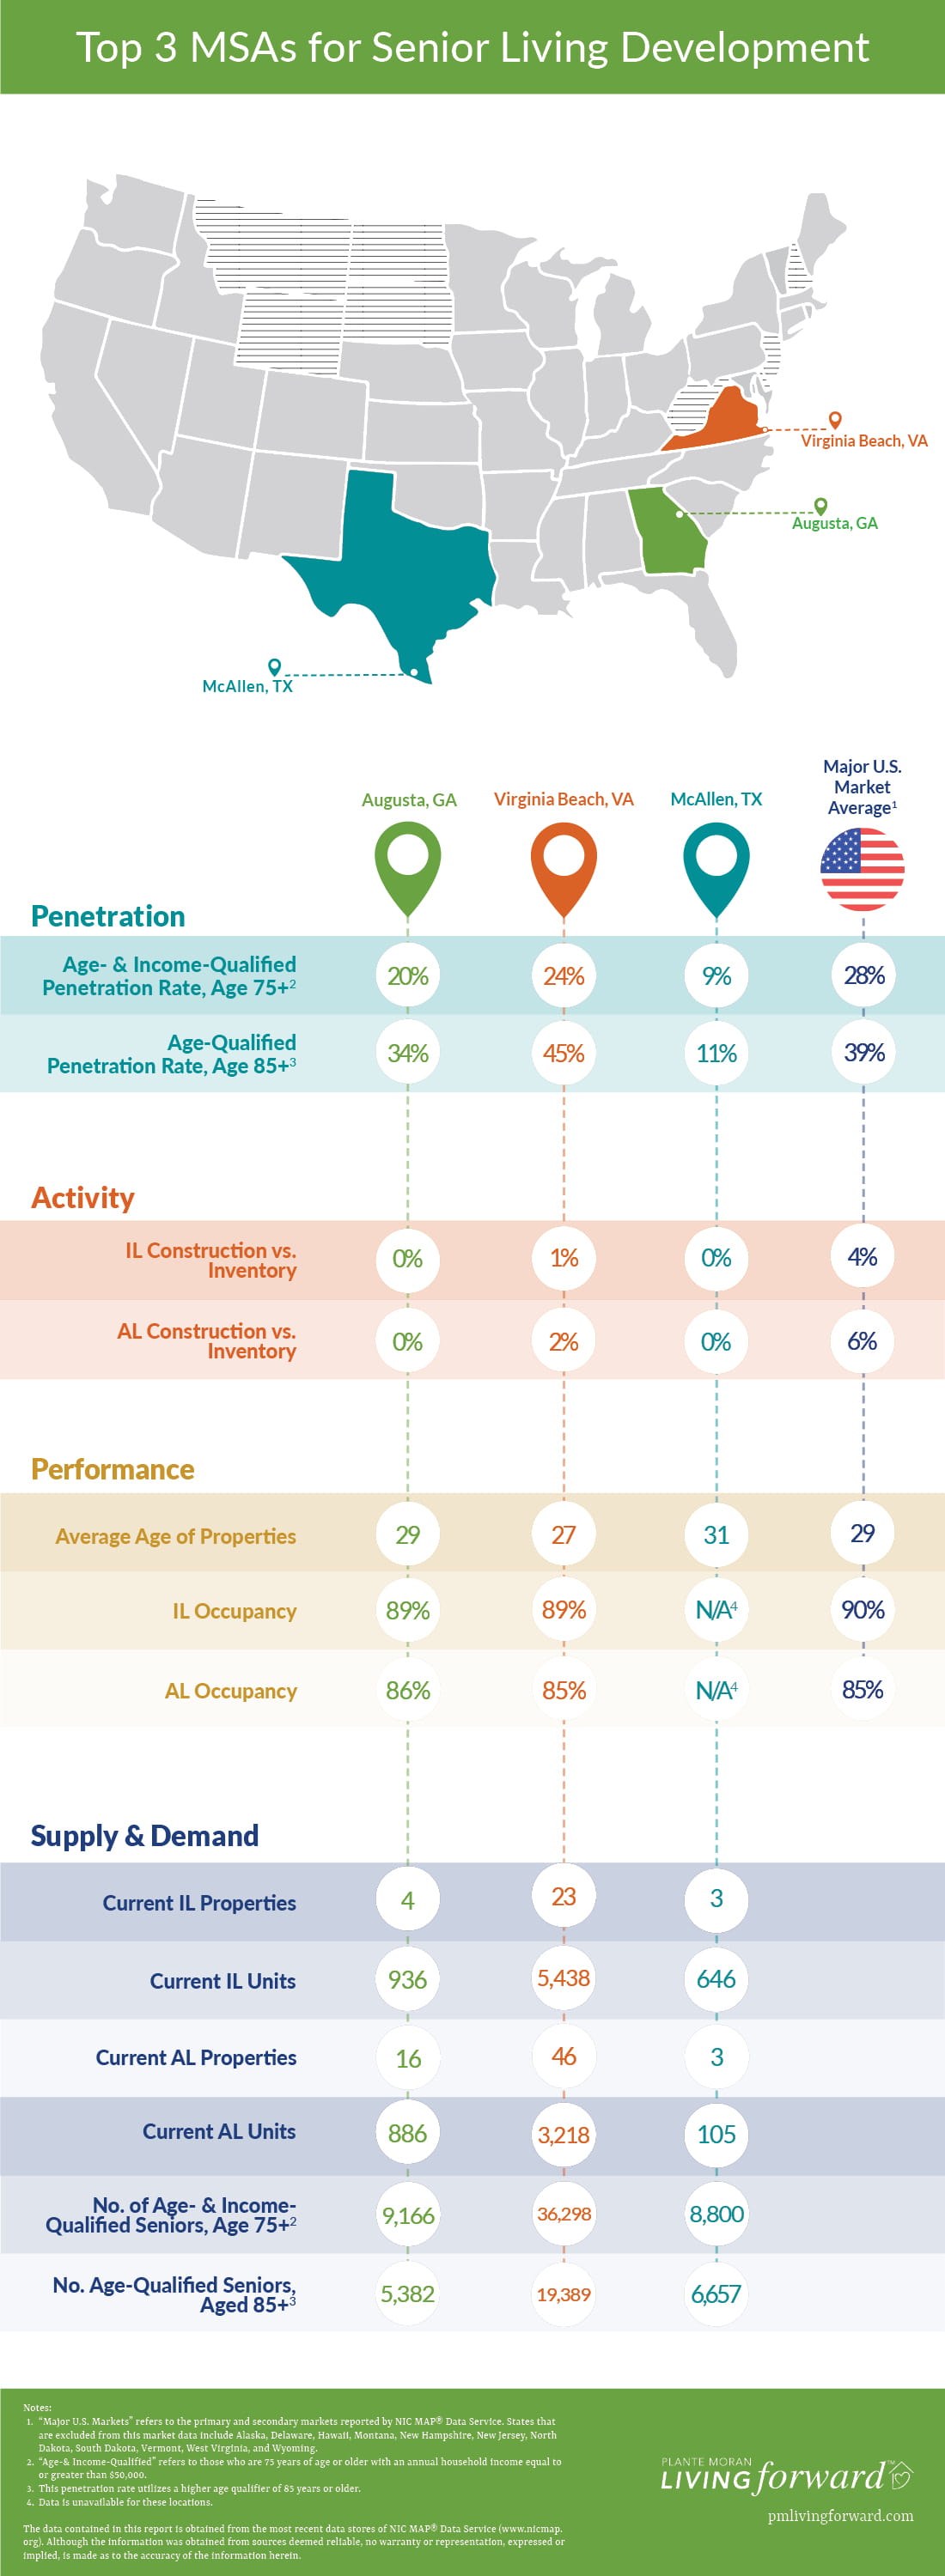
Topping the charts are Augusta, Georgia; Virginia Beach, Virginia; and McAllen, Texas. What’s driving these three metros to the top of our rankings?
Senior living development outlook for Augusta, Georgia
The Augusta MSA’s favorable senior living environment is driven by its positive marks in almost all indicators. The penetration rates — assessed for 75+ households earning $50,000 or more and 85+ households — are below the major market averages. Occupancy for assisted living and independent living are both nearing the 90% mark. None of the indicators we looked at suggest this market is saturated.
With no reported construction activity and an average property age approaching 30 years, this market hints at a need for additional units in the future. We’d recommend anyone interested in this market look deeper into the penetration rate and local competition with a full market study to truly understand the opportunities available.
Senior living development outlook for Virginia Beach, Virginia
While not a stunner in any one metric, the Virginia Beach MSA stood out in our rankings because of its combination of reasonable occupancies, minimal construction activity, and penetration rates that are on-par with the market average. In the case of penetration rates for the 75+ households earning $50,000 or more, the Virginia Beach MSA is below the major market average. The MSA has little reported construction activity and the average age of properties is 27 years.
Most other MSAs have at least one sub-par indicator to warrant caution, but the Virginia Beach MSA is at least average or close to it in all indicators. In addition, AARP has pegged the state of Virginia for significant growth. Even with these optimistic macro factors, more information is needed to choose the most favorable location for your senior living facility within that MSA before moving forward with any new development.
Senior living development outlook for McAllen, Texas
The McAllen MSA is the biggest unknown of the MSAs listed here, but also the one with the most potential thanks to its extremely low penetration rates driven by a very small presence of existing senior living in the market. The penetration rates for both the 75+ households earning $50,000 or more and the 85+ households are well below the major market averages.
It’s the smallest market of the three listed here, but boasts by far the fewest competitors, a lack of development activity, and a slightly older existing product. Further exploration into this market could reveal mitigating factors, but the outlook for senior living development is very favorable based on the metrics we compared.
Check out this graphic for the specific data we assessed in this analysis:
Steps to plan your next senior living development
Many investment experts consider senior living a good investment because it is a high-growth industry. Despite overbuilding in some markets, there is a plethora of opportunity if you take the time to strategically plan your entrance into a favorable market.
We curated our top metros list based on several data points at an MSA level that correlate with demand. But remember, choosing to open a senior living facility at a particular location is much more complex. You must take into account a variety of factors that can only be uncovered in a comprehensive market study. Market studies account for more than just favorable trends — they look specifically at a neighborhood and its surrounding market area for demand indicators like penetration rates, occupancy, labor, age- and income-qualified seniors and adult children, existing and planned competition, and many more factors.
Market studies offer the data you need to make an informed decision about your next senior living development project.
The data contained in this report is obtained from the most recent data stores of NIC MAP® Data Service (www.nicmap.org). Although the information was obtained from sources deemed reliable, no warranty or representation, expressed or implied, is made as to the accuracy of the information herein.