

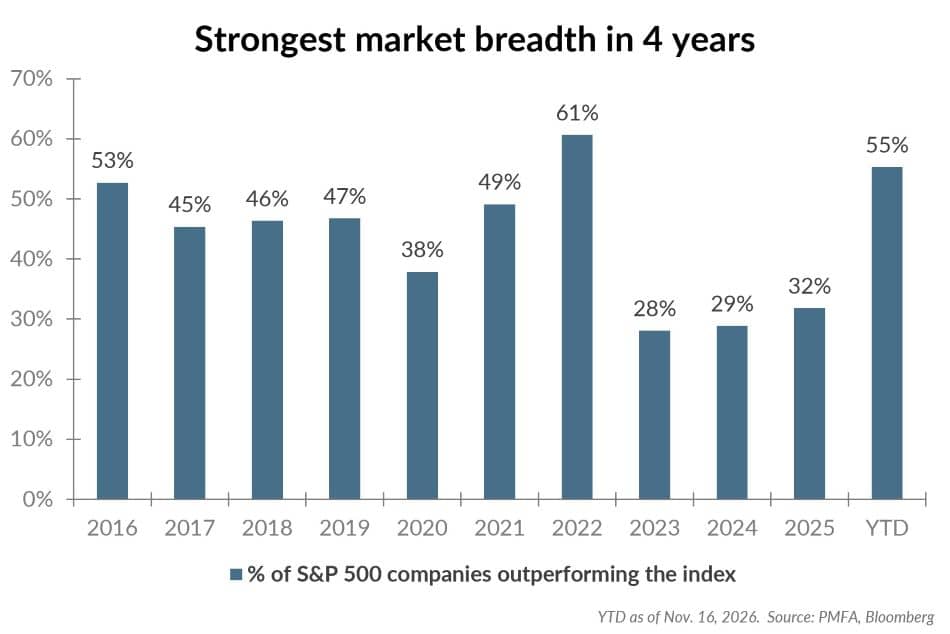
For much of the past three years, the stock market’s advance has rested on a comparatively narrow foundation. From 2023 through 2025, fewer than one in three S&P 500 companies outperformed the index each year, as a small group of mega-cap technology names — many tied to the AI investment cycle — did much of the heavy lifting. This year, that picture has shifted meaningfully. Through November 9, half of the index’s constituents are outperforming the S&P 500, the highest share since 2022 and modestly above the range that prevailed in the years leading up to the pandemic.
The broadening in market participation has occurred alongside a strong fundamental backdrop. With nearly 90% of S&P 500 companies having reported third-quarter results, earnings are on pace to grow more than 30% from a year ago, with all 11 sectors reporting positive growth. Robust earnings growth has also helped valuations reset lower even as the index has advanced by more than 8% this year.
Broader market participation during recent volatility highlights the benefits of diversification. In October, many AI-related stocks fell by double digits amid heightened scrutiny of hyperscaler spending plans. Yet, despite the large weight that these companies hold in the index, the S&P 500 finished the month down less than 1%, with nine of the 11 S&P sectors posting positive performance. Eight of the 11 sectors advanced by more than 5% during the month.
Broader market participation, healthy earnings growth, and rapidly shifting leadership reinforce the value of maintaining a well-diversified portfolio and keeping a long-term perspective.
Past performance does not guarantee future results. All investments include risk and have the potential for loss as well as gain.
Data sources for peer group comparisons, returns, and standard statistical data are provided by the sources referenced and are based on data obtained from recognized statistical services or other sources believed to be reliable. However, some or all of the information has not been verified prior to the analysis, and we do not make any representations as to its accuracy or completeness. Any analysis nonfactual in nature constitutes only current opinions, which are subject to change. Benchmarks or indices are included for information purposes only to reflect the current market environment; no index is a directly tradable investment. There may be instances when consultant opinions regarding any fundamental or quantitative analysis may not agree.
Plante Moran Financial Advisors (PMFA) publishes this update to convey general information about market conditions and not for the purpose of providing investment advice. Investment in any of the companies or sectors mentioned herein may not be appropriate for you. You should consult a representative from PMFA for investment advice regarding your own situation.


