

Markets don’t like uncertainty, and elections can create plenty of it. Questions surrounding control of Congress and the potential direction of tax, spending, trade, and regulatory policy have often historically weighed on sentiment as Election Day approaches.
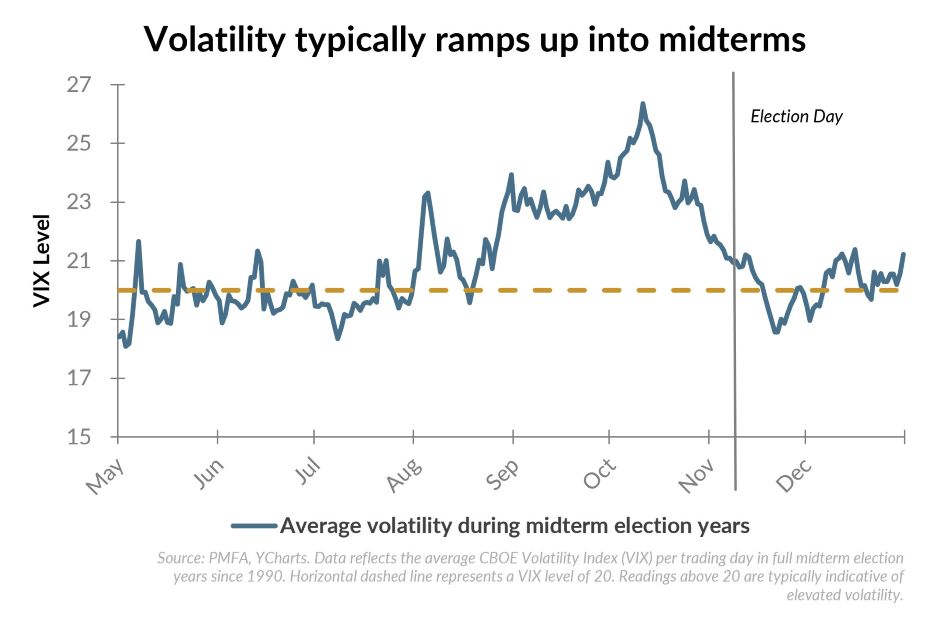
The accompanying chart shows the average level of the CBOE Volatility Index, or VIX, during the nine midterm election years since 1990. On average, volatility began to rise through late summer and peaked in October before declining sharply around election day and easing through year-end.
The explanation is relatively straightforward. Before an election, markets must account for a wide range of political and policy outcomes. Once the results become clearer, that range narrows. Markets don’t necessarily need a particular outcome, but greater clarity allows investors to assess the implications and move forward with more confidence in their investment decisions.
This year’s economic backdrop adds complexity. Growth has held steady around 2% through the first half of the year, with better consumption adding to strong business investment and a resilient labor market. At the same time, inflation remains sticky well above the Federal Reserve’s target sufficient to push Fed policymakers to hike their policy rate and hint at more to come.
The historical pattern isn’t a roadmap for 2026, but it still provides useful perspective. Election-related uncertainty may contribute to near-term volatility, although history suggests that it typically recedes once the outcome becomes clear. For investors, maintaining a diversified portfolio aligned with long-term goals remains more reliable than attempting to position around an election forecast.
Past performance does not guarantee future results. All investments include risk and have the potential for loss as well as gain.
Data sources for peer group comparisons, returns, and standard statistical data are provided by the sources referenced and are based on data obtained from recognized statistical services or other sources believed to be reliable. However, some or all of the information has not been verified prior to the analysis, and we do not make any representations as to its accuracy or completeness. Any analysis nonfactual in nature constitutes only current opinions, which are subject to change. Benchmarks or indices are included for information purposes only to reflect the current market environment; no index is a directly tradable investment. There may be instances when consultant opinions regarding any fundamental or quantitative analysis may not agree.
Plante Moran Financial Advisors (PMFA) publishes this update to convey general information about market conditions and not for the purpose of providing investment advice. Investment in any of the companies or sectors mentioned herein may not be appropriate for you. You should consult a representative from PMFA for investment advice regarding your own situation.
.jpg?la=en&h=307&mw=480&w=480&hash=B3933C39F4E8A96C36E339BFF108FEA0)

