

Recently, we have been hearing a familiar refrain: the world has changed and technology companies are again leading the way. In a certain sense, the thesis is correct, and the evidence has probably never been clearer than in the last several months. The way that we shop, the way that we communicate, the way that we work, and even the way that we are entertained — all have been significantly impacted by a combination of self-imposed behavioral changes and governmental restrictions on large gatherings, travel, work, and entertainment.
Sometimes change moves at a glacial pace, other times it happens quickly. Certainly, e-commerce didn’t spring into life since March, but the forces that have moved more consumers to shopping online over the past two decades have accelerated tremendously in recent months. With such massive shifts taking place in various aspects of everyday life, the existing paradigm has been disrupted, accelerating existing trends and creating winners and losers among providers of goods and services to businesses and consumers.
Traditional brick-and-mortar retailers were, in many cases, already struggling; that turbulence has now increased. Retail bankruptcies were among the first to hit the headlines in the aftermath of lockdowns. Online behemoths and traditional retailers with a strong online presence have benefited from both an increased preference to shop from home, and when there are limited alternatives. Many of the companies that have been perceived to be among the winners in a post-COVID-19 world have seen their stock prices soar this year, even as other parts of the market have swooned. The result? Investors have piled into a handful of names in droves, with perhaps the most notable beneficiaries being the so-called FAANGM stocks (Facebook, Apple, Amazon, Netflix, Google, and Microsoft.)
These businesses seem to have defied expectations as they performed comparatively well in the initial sharp decline from mid-February to March 23. Investors turned to known quantities, some of the more dominant stocks that had the potential to be more insulated from the weakening economic conditions. Yet, FAANGM also fared well in the incredible rebound since then, as they were uniquely positioned to thrive in the COVID-19 crisis environment. Technology leaders were already well positioned to benefit from those rapidly changing conditions, a shift for many to working from home, a boost to e-commerce, and the delivery of personalized, in-home entertainment, among other important shifts.
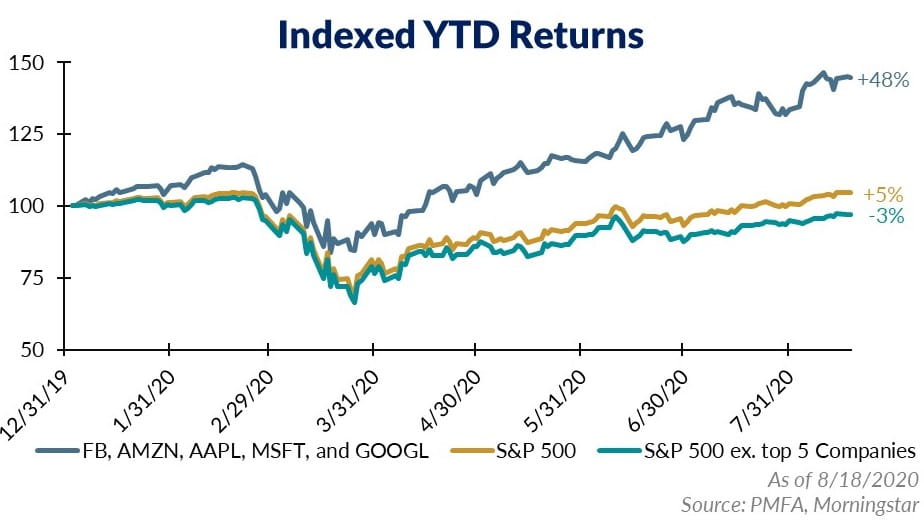
There is little doubt that these are strong businesses with massive free cash flows, stable balance sheets, and quality management teams. However, despite their strong revenue and earnings growth, stock prices for these companies have risen at an even faster pace. Despite market capitalizations, that for several of these companies now exceeds $1 trillion (with Apple actually becoming the first company to top $2 trillion on August 19), investors continue to pile into these familiar names. Despite an arguably compelling long-term investment thesis, the strength of recent performance momentum is also driving more investors to speculate by aggressively piling in with less attention to price. The result? Valuations have risen considerably.
It’s reminiscent of the go-go days of the 1990s, when internet stocks were the rage in what was deemed the “new economy.” During that period, investment gave way to outright speculation, as Wall Street served up a laundry list of IPOs for any number of dot.com stocks built on the promise of an information economy that would transform the way that we all lived in the decades ahead, and earnings that would one day appear.
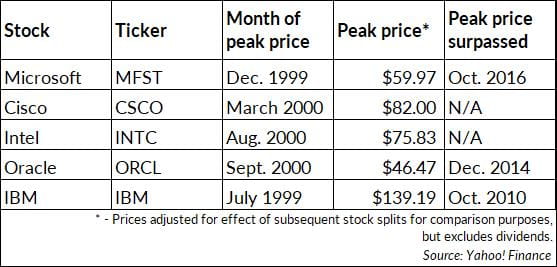
With hindsight, we know how the tech bubble ended, despite the fact that the underlying thesis was right. In fact, the internet was going to change the world, and many companies that were connected to the coming technology boom would become global leaders. But that didn’t mean all of those businesses would be successful, it didn’t mean that all investors would profit, and it certainly didn’t mean that, over the long term, price wouldn’t matter. As the bubble burst, the tech sector went into a steep nosedive, with many companies not surviving. As illustrated above, even the five largest names in the infotech space at the time would experience sharp drops in their stock price that would be felt by investors for years to come. Of those names, three (Microsoft, Oracle, and IBM) took over a decade to reach their respective price peaks from the bubble era; the remaining two (Cisco and Intel) have yet to return to their 2000 highs even now, 20 years later.
Instead, investors shifted their attention to focus on parts of the market that had been cast aside. Small-cap stocks came back into favor and outperformed large caps from 2000–2006. Value-oriented companies also returned to leadership and outperformed growth over that same period — not because those tech companies were no longer dominant players, but because the prices at the peak of the euphoria were just too high, well beyond levels that even many years of strong future growth could justify.
History doesn’t typically repeat, but it often rhymes. Two decades after the great tech bubble, there are warning signs today about the potential for another. Certainly, investors piling into a group of the leading names today point to the changing nature of the economy and consumer habits. But there is the real risk that investing based on a stock’s merits gives way to speculating based on that price momentum and chasing returns. In the short run, the influx of additional flow of funds can continue to lift prices, perpetuating that momentum. That is the familiar pattern for asset bubbles, played out time and again in the history of the capital markets.
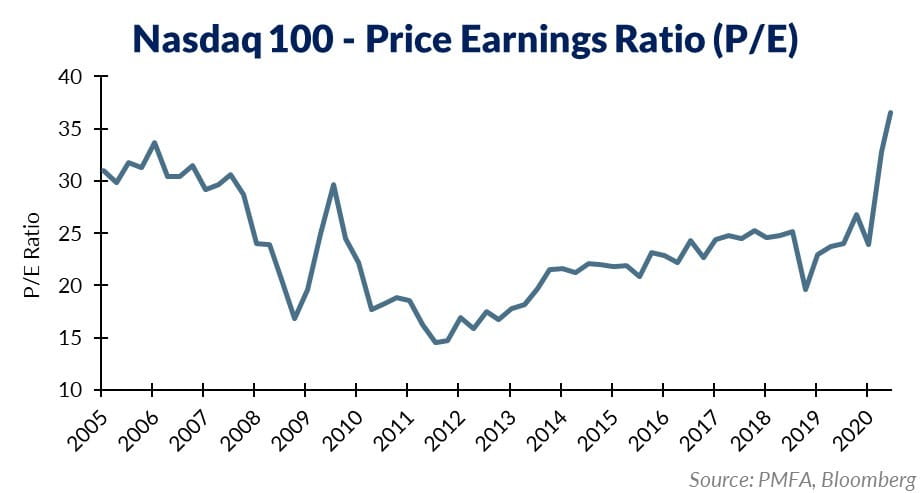
Are the recent outsized gains in large-cap tech evidence of a bubble building? Risks have certainly risen as FAANGM valuations have been pushed ever higher. Notably, though, these are very profitable enterprises. For several years now, FAANGM has averaged in the low 20% range in terms of profit margins while the broader market, as measured by the S&P 500, has averaged slightly above 10%. Despite strong profitability, the Price/Earnings ratio on the tech-heavy Nasdaq 100 Index has been pushed higher, recently topped 35 times earnings (based on trailing earnings) — the highest point since the first quarter of 2004.
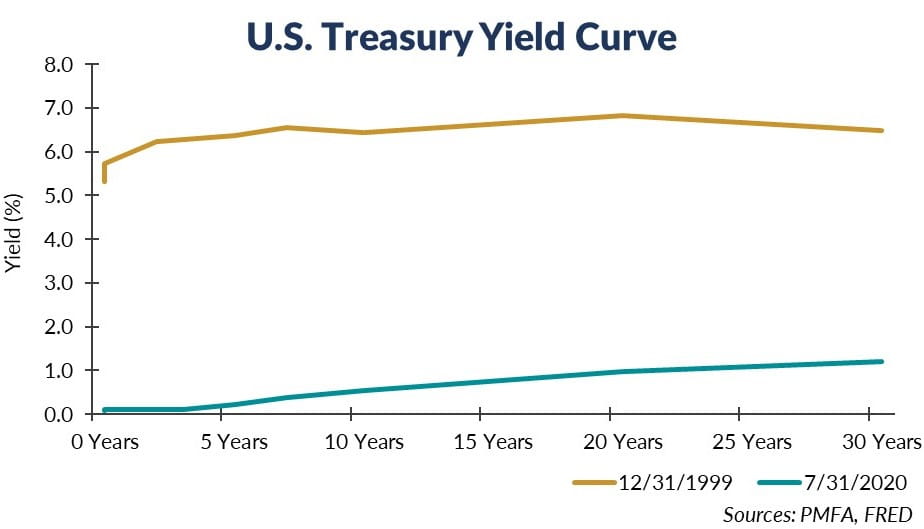
FAANGM has been awarded a premium valuation, at least in part, due to its consistently high profitability and earnings power. Earnings for FAANGM have also been strong, with some considering them to be secular growers as technology, and software specifically, has become ever more integrated across sectors and industries. Another pillar of support for FAANGM has been ultra-low interest rates since the Great Financial Crisis, allowing these companies to borrow at exceedingly low rates to fund growth and investment. As illustrated above, interest rates have declined significantly since 1999, making debt as a source of capital much less expensive today. Historically, higher growth companies have benefited from low-rate and low-inflation environments, especially when growth has been relatively scarce as seen over much of the past decade.
Although seemingly bulletproof given their massive sizes, global scale, and customer base, these companies are still susceptible to risk — perhaps the most notable in the near term is that of regulation. While Republicans and Democrats in Washington, D.C., agree on little these days, the dominant market presence of these companies and growing awareness of privacy risks are increasingly pressuring policymakers to take regulatory action. Facebook, Amazon, Alphabet, and Microsoft have all come under scrutiny in recent years or remain in the sights of Congress. No matter the outcome of the election in November, it appears likely that Big Tech will remain under close watch.
Is there a bubble forming today? If so, how far could momentum carry the affected stocks? Evidence of froth is clearly present, but there’s no way to say with certainty. We believe there is a place in a diversified portfolio for companies that are leading innovation and that are well positioned to profit from both the recent changes and the long-term evolution in how we work, live, shop, and play. Still, any investment should be sized appropriately to fit within the context of one’s greater financial goals, objectives, and risk parameters. The transition from investment to speculation in stocks isn’t always obvious on the surface as momentum carries prices higher and investors seek new ways to justify perpetually rising valuations. This is just as true today as it was with former “can’t-miss” investments that were the darlings of Wall Street, whether it was the “Nifty Fifty” stocks of the 1970s, the China/commodity stock boom of the mid-2000s, or the tech titans of 20 years ago. Investors should be careful to not get caught up in the exuberance.
The bottom line? Tech stocks hold a place in a well-diversified portfolio, but one that is sized appropriately — not based on the expectation for an indefinite extension of recent price momentum, but on its intrinsic value, its growth potential over the long term, and its ability to provide a rate of return commensurate with its underlying risk. Investors need to exercise caution any time there is a “can’t-lose” investment proposition. Even when the investment thesis holds merit, price still matters, and there’s still a limit to the price that should be paid for even world-class companies.
Past performance does not guarantee future results. All investments include risk and have the potential for loss as well as gain.
Data sources for peer group comparisons, returns, and standard statistical data are provided by the sources referenced and are based on data obtained from recognized statistical services or other sources believed to be reliable. However, some or all information has not been verified prior to the analysis, and we do not make any representations as to its accuracy or completeness. Any analysis non-factual in nature constitutes only current opinions, which are subject to change. Benchmarks or indices are included for information purposes only to reflect the current market environment; no index is a directly tradable investment. There may be instances when consultant opinions regarding any fundamental or quantitative analysis may not agree.
Plante Moran Financial Advisors (PMFA) publishes this update to convey general information about market conditions and not for the purpose of providing investment advice. Investment in any of the companies or sectors mentioned herein may not be appropriate for you. You should consult a representative from PMFA for investment advice regarding your own situation.


