
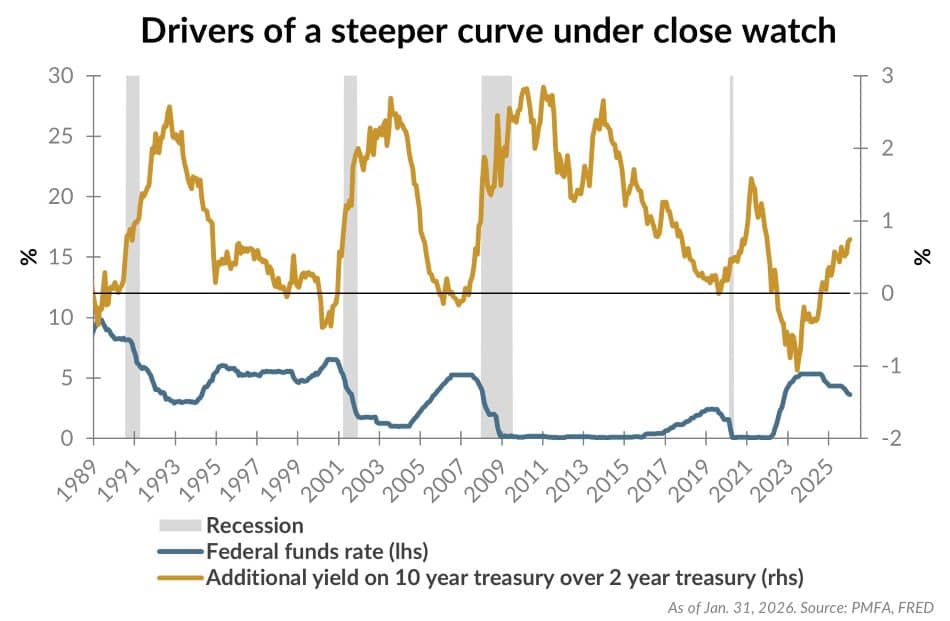
In discussions of interest rates, one phrase often referenced is the shape of the yield “curve.” Simply put, it reflects how yields differ across bond maturities. Typically, that translates to lower yields for cash and short-term instruments and higher yields for long-term debt. In the chart above, the gold line shows the difference between 10-year and two-year Treasury yields, often referred to as term spread. As you can see, that spread turned positive in 2024 after more than two years of an inverted yield curve — an unusual period when short-term yields were higher than long-term yields. Since then, the curve has continued to “steepen,” with 10-year Treasuries now yielding nearly 1% more than their two-year counterparts.
A positively sloped yield curve is generally a constructive backdrop for core bonds compared with cash. Investors are paid more for extending out beyond cash-like investments, which improves the relative appeal of longer-dated bonds. This played out in 2025, as core bonds have meaningfully outperformed cash last year.
There are two ways in which a yield curve can steepen. The first is a result of falling short-term rates, typically driven by Federal Reserve rate cuts when economic growth begins to slow, or inflation is falling. The second is through rising long-term rates, which can occur when investors demand greater compensation for inflation risk or as a reflection of stronger economic growth. Recently, both dynamics have been at work.
At its most recent meeting, the Fed held rates steady, signaling a more patient approach following rate cuts in late 2025. Markets now expect additional, gradual easing ahead, reflecting an economy that remains resilient even as inflation continues to run above the Fed’s long-term target. In the near term though, the Fed looks increasingly likely to stand pat, holding short-term rates steady. What the Fed’s stance on short-term rates means for long-term yields is a bit more complicated.
Investors are also paying closer attention to the impending change in leadership at the Federal Reserve. The White House recently nominated former Fed Governor Kevin Warsh to succeed Chair Jerome Powell when his term ends in May. Warsh has historically leaned toward higher interest rates and tighter monetary policy, though more recently he has supported lower rates and a reduction in the size of the Fed’s balance sheet. The latter has raised questions about the potential for long-term yields to rise, particularly if the Fed allows its balance sheet to contract, effectively pushing more Treasury and mortgage bond supply into the market, requiring other investors to absorb that supply. All else being equal, that would be expected to put upward pressure on long-term yields. Whether that ultimately plays out remains to be seen, as it would still require a shift in the broader views of the FOMC and can’t be driven solely by a change in leadership.
Looking ahead, the path of the yield curve will largely depend on how the outlook for growth and inflation evolve. If economic momentum were to slow, the Fed would likely renew rate cuts more quickly than markets currently expect, pushing short-term yields lower. If growth remains solid, the labor market stabilizes, and inflation proves persistent, the Fed’s likely to stay on hold and longer-term yields could rise as investors demand higher compensation. Either scenario would result in a steeper curve — but for very different reasons.
For investors, the key question isn’t just whether the yield curve steepens, but why. Whether driven by falling short-term rates or rising long-term yields, the source of the steepening will offer important clues about the underlying economic environment — and will matter most as we navigate market opportunities and risks and the resulting impact on portfolio positioning.
Past performance does not guarantee future results. All investments include risk and have the potential for loss as well as gain.
Data sources for peer group comparisons, returns, and standard statistical data are provided by the sources referenced and are based on data obtained from recognized statistical services or other sources believed to be reliable. However, some or all of the information has not been verified prior to the analysis, and we do not make any representations as to its accuracy or completeness. Any analysis nonfactual in nature constitutes only current opinions, which are subject to change. Benchmarks or indices are included for information purposes only to reflect the current market environment; no index is a directly tradable investment. There may be instances when consultant opinions regarding any fundamental or quantitative analysis may not agree.
Plante Moran Financial Advisors (PMFA) publishes this update to convey general information about market conditions and not for the purpose of providing investment advice. Investment in any of the companies or sectors mentioned herein may not be appropriate for you. You should consult a representative from PMFA for investment advice regarding your own situation.


