
The University of Michigan Consumer Sentiment Index gauges how U.S. households view the near-term economic outlook and their personal financial health. Recently, that outlook has soured, with the index declining for four consecutive months, heavily influenced by the uncertainty stemming from recently announced trade policy changes and the potential impact on both the economy and their finances. In fact, the index’s subcomponent measuring near-term expectations for the future has fallen by 32% since January, marking the sharpest three-month percentage drop in over 30 years.
Economists often describe this data as “soft” data, meaning it’s based on a survey of how people feel rather than what they’ve done. Information gathered about what consumers and businesses have done, such as the retail sales and employment reports, is considered “hard” data. Although cracks have started to appear in hard data, most notably the Q1 GDP report, they aren’t yet commensurate with the magnitude of decline in sentiment.
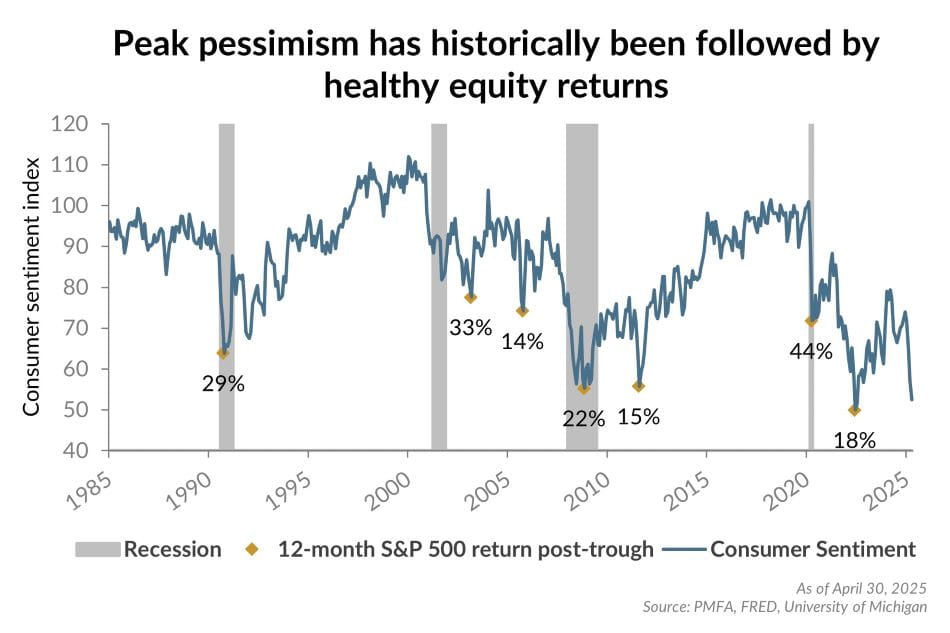
The chart above reveals a potentially intuitive pattern, illustrating that periods following a trough in consumer sentiment tend to correspond with strong stock market returns. Although changes in survey methodologies (such as conducting surveys via the internet rather than by phone) may skew the level of recent data versus long-term history, the index’s track record as a contrarian signal remains compelling. Having said that, any trough in sentiment is only recognizable in hindsight; while recent readings have been exceptionally weak, a further decline is certainly possible.
At the same time, the sentiment data does speak to the risk of exiting the market when the outlook is uncertain. Historically, equities have generally performed well following periods of similarly poor sentiment, typically posting double-digit gains within the following 12 months.

.jpg?la=en&h=307&mw=480&w=480&hash=44A92388F3F9E8FE565D440232F38669)
