
In its June meeting, the Federal Open Market Committee (FOMC) opted to hold the federal funds rate steady for the fourth consecutive time, continuing its data-dependent, wait-and-see approach. At the same time, the updated Summary of Economic Projections (SEP) signaled a more tempered outlook for the U.S. economy.
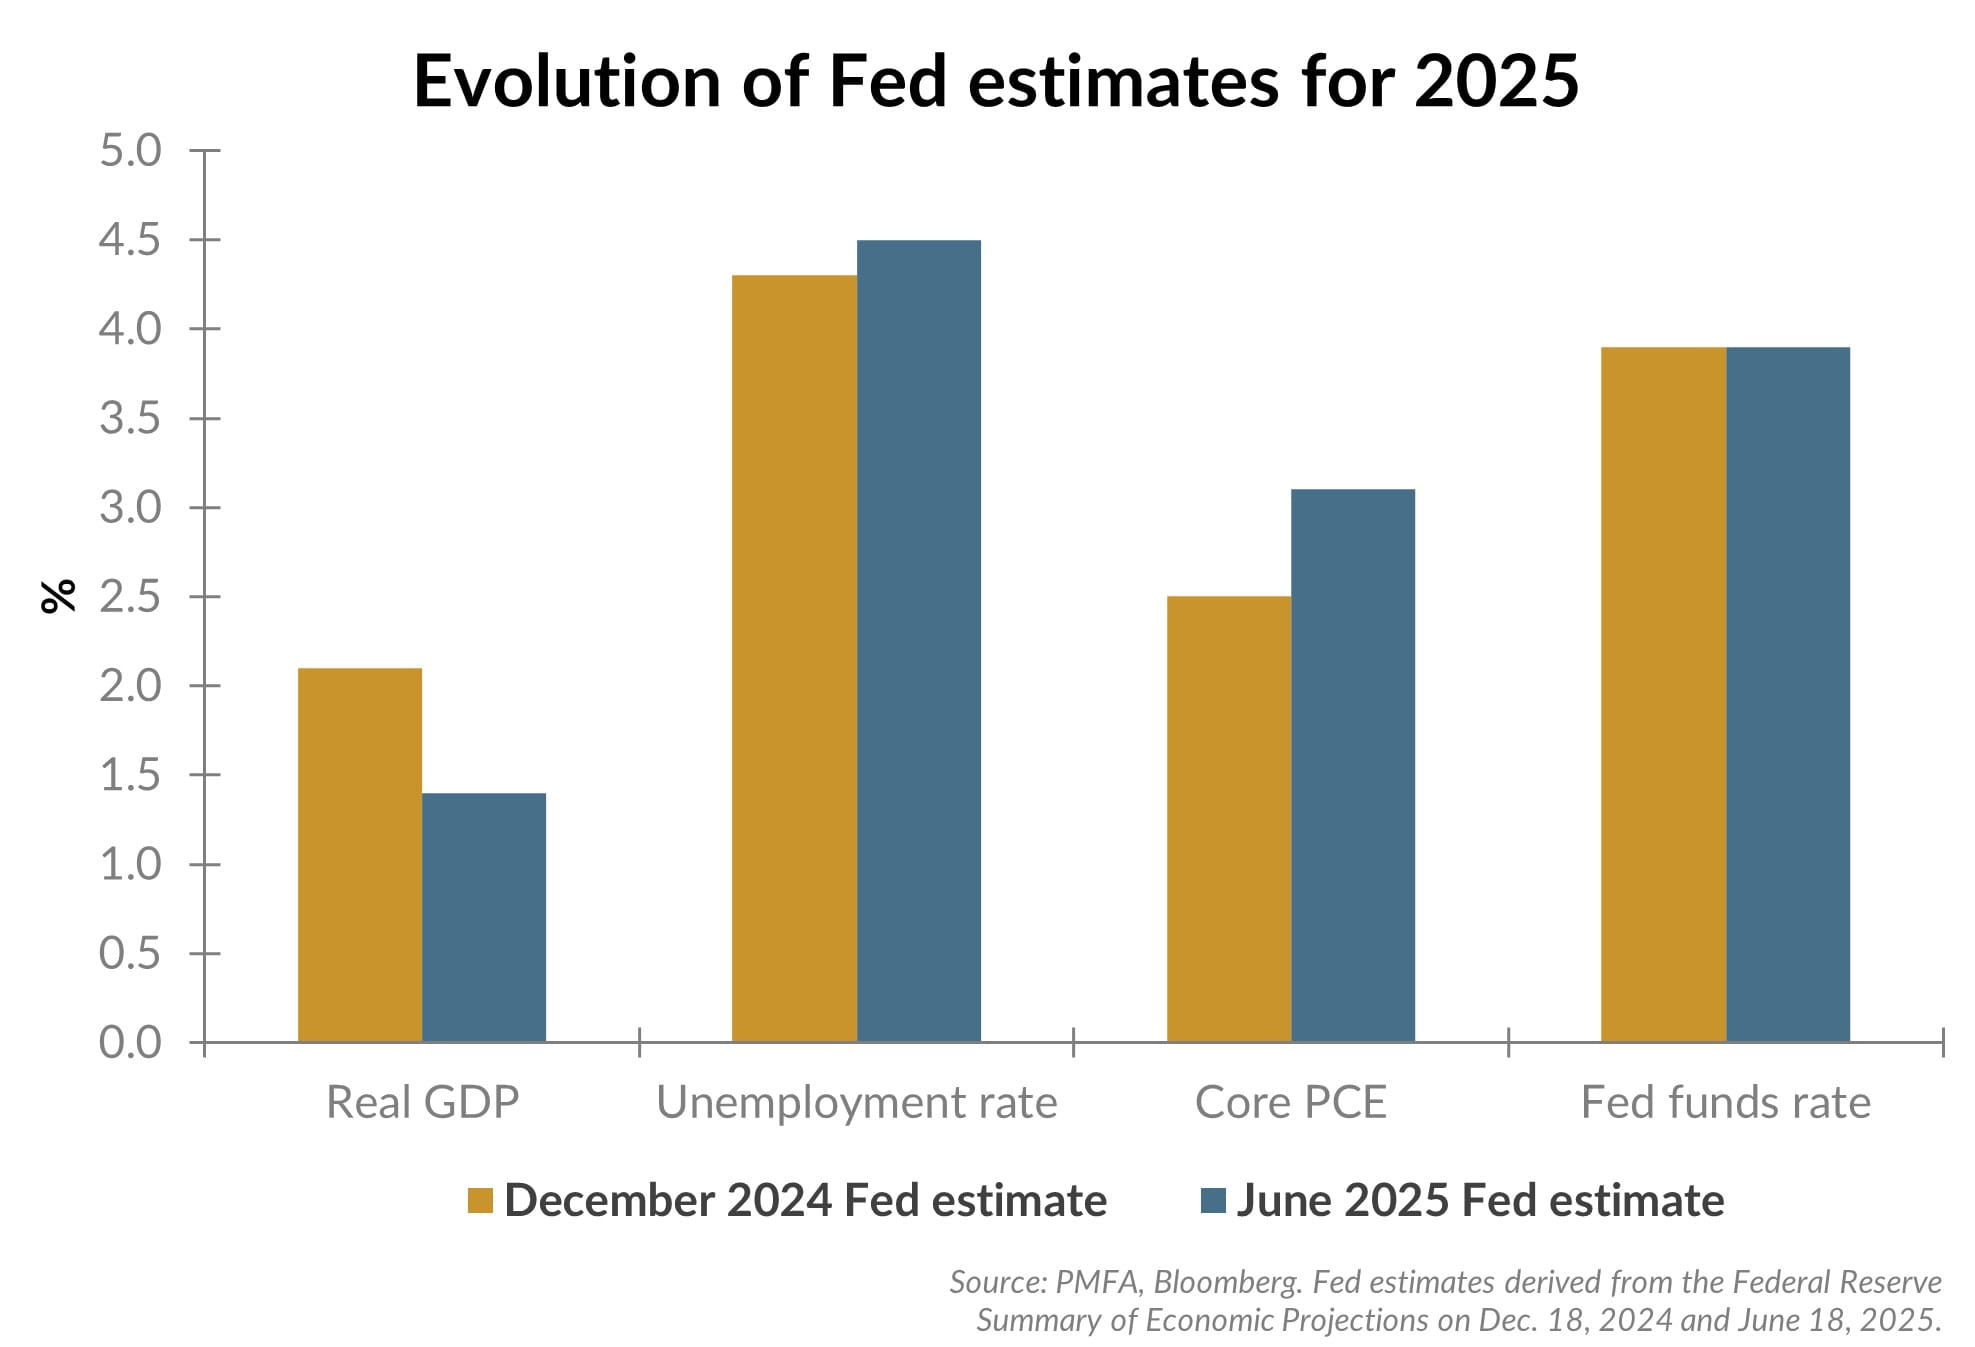
Comparing its December projections — the last time the FOMC met and cut interest rates — to June’s estimates (roughly halfway through the year), we have seen expectations for growth and the labor market soften, while inflation expectations have edged higher. GDP growth for 2025 was revised down to a below trend pace of 1.4%, previously 2.1%, and the unemployment rate shifted higher to 4.5 from 4.3%. These changes reflected signs of moderating consumer spending, softer business sentiment, and ongoing uncertainty around trade policy. Meanwhile, core PCE inflation expectations increased to 3.1%, up from 2.5% in December, highlighting the potential for persistent pricing pressures in the near term.
Left unchanged were expectations for the Fed funds rate, still indicating two rate cuts by year-end, as the Fed is walking a fine line between curbing inflation and supporting economic resilience. Of course, today’s estimates are simultaneously complicated by the balancing of factors: the recently passed tax legislation, the ongoing tariff policy, moderating economic growth, and geopolitical risks. Though the S&P 500 has recently reached new all-time highs, capital markets seem likely to remain choppy as these factors unfold. As always, investors should remain diversified, maintain appropriate cash reserves, and keep a long-term focus.
Past performance does not guarantee future results. All investments include risk and have the potential for loss as well as gain.
Data sources for peer group comparisons, returns, and standard statistical data are provided by the sources referenced and are based on data obtained from recognized statistical services or other sources believed to be reliable. However, some or all of the information has not been verified prior to the analysis, and we do not make any representations as to its accuracy or completeness. Any analysis nonfactual in nature constitutes only current opinions, which are subject to change. Benchmarks or indices are included for information purposes only to reflect the current market environment; no index is a directly tradable investment. There may be instances when consultant opinions regarding any fundamental or quantitative analysis may not agree.
Plante Moran Financial Advisors (PMFA) publishes this update to convey general information about market conditions and not for the purpose of providing investment advice. Investment in any of the companies or sectors mentioned herein may not be appropriate for you. You should consult a representative from PMFA for investment advice regarding your own situation.


