
As discussed in our accompanying piece, the recovery appears to be underway. The speed of change has been unprecedented in such a short period: from moderate growth to an unusually severe (albeit short) recession to the early stages of a recovery that was more robust and rapid than economists had expected. All of this has transpired before the government even publishes its first report on Q2 GDP, which is set for released on July 30.
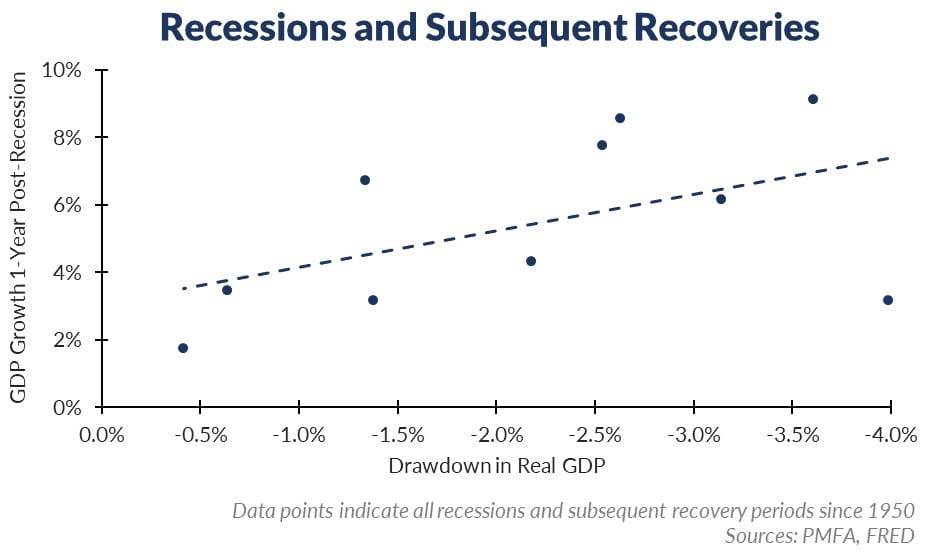
Whatever that report reveals, it’s clear that the contraction was severe. What does that mean for the recovery? As illustrated by the chart above, more severe downturns have tended to be followed by stronger rebounds in the following year. This may be explained in part by the policy response (both monetary and fiscal). Severe recessions have typically been accompanied by more aggressive stimulus measures to blunt its impact. That certainly held true in recent months, with aggressive monetary stimulus accompanied by an unprecedented fiscal response.
After every recession, the economy requires time to heal and to return to its prerecession strength. Today, progress could be slowed if the recent surge in COVID-19 cases persists, prompting another wave of shutdowns. Still, if history is a guide, as that risk fades and a durable recovery starts, growth is likely to not only be well above long-term trend but could exceed the rebound that has followed a more typical recession.
Past performance does not guarantee future results. All investments include risk and have the potential for loss as well as gain.
Data sources for peer group comparisons, returns, and standard statistical data are provided by the sources referenced and are based on data obtained from recognized statistical services or other sources believed to be reliable. However, some or all of the information has not been verified prior to the analysis, and we do not make any representations as to its accuracy or completeness. Any analysis nonfactual in nature constitutes only current opinions, which are subject to change. Benchmarks or indices are included for information purposes only to reflect the current market environment; no index is a directly tradable investment. There may be instances when consultant opinions regarding any fundamental or quantitative analysis may not agree.
Plante Moran Financial Advisors (PMFA) publishes this update to convey general information about market conditions and not for the purpose of providing investment advice. Investment in any of the companies or sectors mentioned herein may not be appropriate for you. You should consult a representative from PMFA for investment advice regarding your own situation.


