
Food and beverage market dynamics are rapidly changing the mix of products demanded by customers. As raw material purchasing and production adapt to consumer trends, your cost and margin data can quickly fall out of balance.
Think of the chicken processor experiencing a significant change in demand from chicken breasts to chicken thighs as families try to save money, the smoked fish processor that had to pivot from supplying cruise lines to retail operations, or the fruit processor who supplied premium whole fruit to school lunch programs and, when schools moved to remote education, was forced to shift production to juice and sauce.
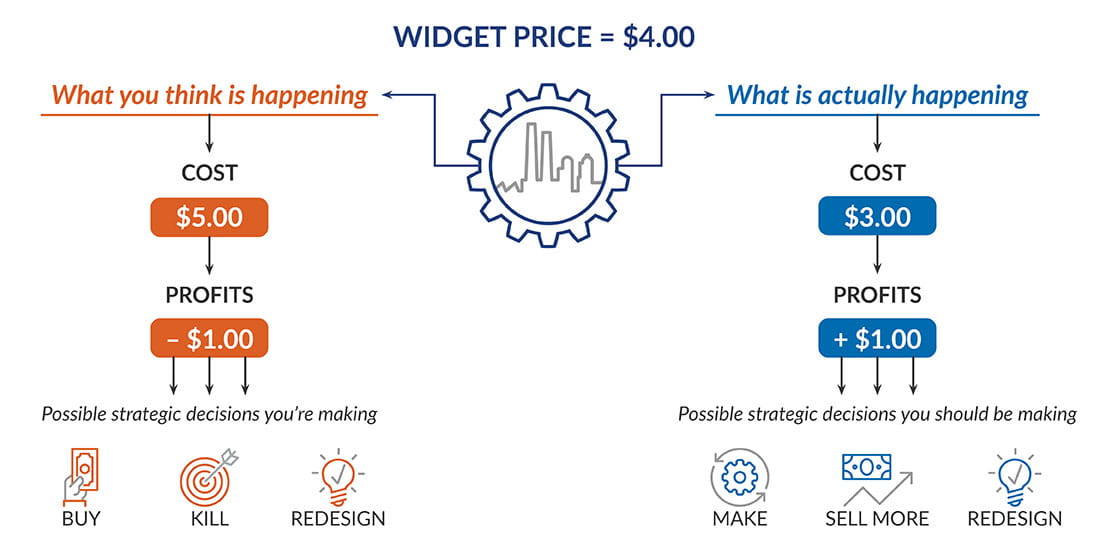
Accurate costing is crucial to decision-making, especially as your product mix changes. A true understanding of costs and margin helps food and beverage leaders make the best strategic and operational decisions. Ultimately, it allows you to optimize your bottom line.
Costs can be distorted in many common ways, leading you to take on or keep unprofitable customers or miss out on profitable business. We constantly see the same issues — unit of measure discrepancies, varying use of scrap and yield factors, shipping costs, overhead rates — these are low-hanging fruit when it comes to assessing and improving your costing function.
Much of the cost data is often held within your ERP and can be the source of trust or doubt in is reporting of inventory and margin data. If the inputs are off, if your system’s underlying master cost data isn’t accurate, you can’t expect accurate output. Are you falling into similar traps? The following questions can help you avoid them.
Are your BOMs (bills of materials) accurate?
Maybe you purchase an ingredient in drums or cases but use it in quarts or gallons. Do your BOMs account for different measurement units throughout your process? Are your BOMs updated for dynamic changes in raw material components?
BOMs that aren’t properly maintained and updated can cause costing inaccuracies and create MRP issues. We’ve worked with multiple clients that weren’t disciplined in changing BOMs as raw material or production inputs changed. This resulted in inaccurate usage variances and inventory costing that took some time to uncover and could lead to misinformed business decisions.
Where are you effecting scrap and yield assumptions?
Are all staff who work with scrap and yield factors, including employees entering BOMs, production routers, and quality managers, using them consistently to avoid compounding and other errors? For example, one person may include yield in the BOM quantity, while another staff member may enter a yield factor.
How do you assign shipping costs?
Inbound freight is often calculated as an average cost per material spend, yet inbound freight costs can vary significantly by supplier, country of origin, incoterms, dimensions, weight, and other factors. If inbound freight is a significant expense (whether in the piece price or not), using average costs will lead to undercosting some items while overcosting others — sometimes significantly.
Are your production routings accurate?
Production routings are critical for accurate costing, scheduling, and capacity planning. If your schedulers or capacity planners are using different cycle times or crewing than what’s in your ERP system, your inventory costs and quoted costs are likely significantly inaccurate. Do your production cycle times and crewing match actual performance on the floor?
We recently worked with a client that employed twice as many people as needed given their line speed. In many cases, these operators were performing nonproductive activities. How much true unproductive time do you have in your direct labor? Is that time hidden in the direct labor rate or crewing factor?
How accurate are your overhead rates and what’s driving overhead costs?
If your overhead absorption matches your spend, you might be costing correctly “on average,” but you could still have incorrect costs at the SKU level. When faced with strategic decisions about particular products — make versus buy, discontinue, sell more, reprice, redesign — do you want to use averages, or do you want accurate SKU-specific cost data to make well-informed decisions?
Do you base your costs strictly on labor hours rather than machine hours? Let’s use a simplified example of the juice line of the fruit processor mentioned earlier. Let’s say the company allocates electricity costs based on labor hours, and 20 labor hours are originally required to work on the line when the BOM is developed. If you were to automate the line and reduce labor hours to one, you’re basing your electricity usage on one labor hour versus the original 20 — a 19-hour drop in the electricity cost allocation. The reality is automation generally reduces labor costs but increases, rather than decreases electricity usage. Basing the allocation on labor hours, in this case, creates a costing error. This example shows how dynamic changes in production can lead to inaccurate costing. Now picture-basing decisions on that inaccurate costing data — it can easily lead you down the wrong path.
Here’s another example using the same fruit processor juice line. The crew on the line may change significantly depending on packaging requirements. As the crew changes, the cost of the line (equipment cost, space, maintenance, utilities, supplies) does not change. Numerous examples like this could lead to making poor management decisions as illustrated below:
A high-level view of overhead costs isn’t enough. You need to understand what’s driving those costs. Rather than peanut-butter-spreading costs, such as electricity, identifying the cost drivers for your significant expenses enables improved cost assignments. In the case of electricity, you could weight machine hours by kilowatt hour consumption and use the result as the allocation basis. The more costs you can assign using accurate cost drivers, the better the results will be for management decision-making.
How often do you review product, customer, and channel profitability?
Once you ensure reasonable accuracy of your BOMs, routers, and rates, the fun begins. The cost and margin insights and decisions you’re now able to make can have an immediate impact on your bottom-line.
Developing cost and margin analytics, whether using spreadsheet applications or leveraging third-party software to monitor product, customer, and channel margin performance, enables you to test the impact of multiple variables and scenarios as the market changes. Such models are a must-have, not a luxury, when making decisions.
Make costing a top priority
An accurate costing and margin analysis system should be a top priority for food and beverage leaders for many reasons. Even the most profitable companies can fall victim to poor costing data at the SKU level. As consumer demand changes and product mix begins to shift, a company challenged with poor SKU-level costing may find its margins quickly shrink from highly profitable to low or negative territory. This could then lead to decisions to outsource or exit the business and cause a company to enter a death spiral — all because it didn’t invest in the resources to ensure and maintain accurate SKU-level costs.
A large, well-known consumer packaged goods (CPG) company approached one of our clients to co-pack for them. The client jumped at the opportunity. A year or so later, the client’s overall margin was beginning to shrink. We dug in to help and found that the cost data and assumptions used to ink the big CPG deal had serious flaws in material costs, labor costs, and especially overhead. With better, more deliberate cost data, the results could have been different — margins higher, profitability greater.
Once you have an accurate picture of the margins by SKU, you can prioritize where to focus your resources. Variances become more meaningful and help you catch negative cost and operational issues before they cause (further) damage.
Costing is where operations and finance intersect, and a strong costing system serves as a common language for managers across the organization. As a result, planning meetings run much more efficiently and productively because leaders can focus on decision-making rather than chasing down unexplained variances and arguing about which department’s costs data is correct.
Some business functions can run on autopilot; successful companies recognize that costing isn’t one of them. As you weigh daily decisions about your pricing, products, and customers, are you confident in your costing function and margin data? If not, we can help. Feel free to give us a call.


