
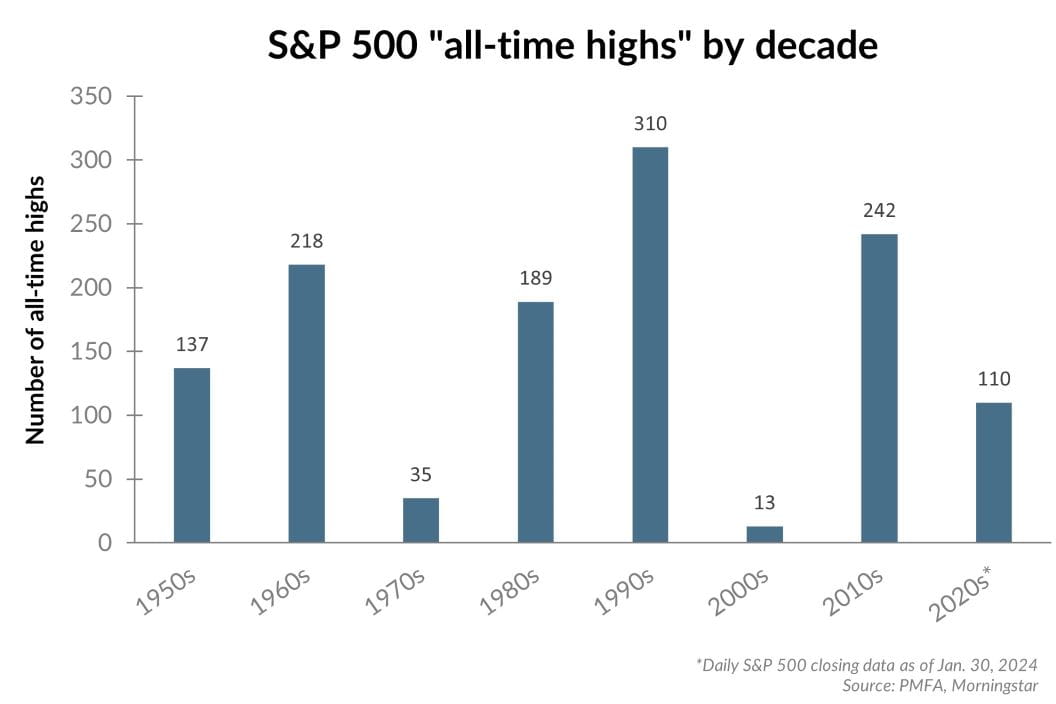
U.S. equity markets, as measured by the S&P 500 index, recently reached a new all-time high, after going roughly two years without surpassing its January 2022 peak. With the index now recording a series of highs since the beginning of the year, the question is whether or not there’s still room for equities to rise. History clearly suggests that there is.
As shown in the chart above, new “all-time highs” for the S&P 500 are fairly common. Since the 1950s, the index has posted over 1,200 new highs, averaging more than 17 new highs per year — more than one in every 20 trading days. It’s also reached multiple new highs in every decade since the 1950s, typically surpassing its previous peak more than 100 times each decade. Two decades (the 1970s and 2000s) were notable outliers, and given the tumultuous market environment in each, that’s not surprising. Even then, markets did post record highs and were followed by a decade of strong advances.
Higher markets over time are to be expected, supported by a range of factors, including long-term population and economic growth, rising prices that support corporate revenue and earnings growth, advances in productivity, and technological advancement.
The simple fact that the market has reached a new peak doesn’t indicate that it can’t continue to rise. To the contrary, the decades that have seen the greatest number of all-time highs have tended to have the strongest equity market performance as well. Investors shouldn’t view the latest “all-time high” for stocks as a destination, but a point along the path for the markets that will be displaced by a new record high in the future.
Past performance does not guarantee future results. All investments include risk and have the potential for loss as well as gain.
Data sources for peer group comparisons, returns, and standard statistical data are provided by the sources referenced and are based on data obtained from recognized statistical services or other sources believed to be reliable. However, some or all of the information has not been verified prior to the analysis, and we do not make any representations as to its accuracy or completeness. Any analysis nonfactual in nature constitutes only current opinions, which are subject to change. Benchmarks or indices are included for information purposes only to reflect the current market environment; no index is a directly tradable investment. There may be instances when consultant opinions regarding any fundamental or quantitative analysis may not agree.
Plante Moran Financial Advisors (PMFA) publishes this update to convey general information about market conditions and not for the purpose of providing investment advice. Investment in any of the companies or sectors mentioned herein may not be appropriate for you. You should consult a representative from PMFA for investment advice regarding your own situation.