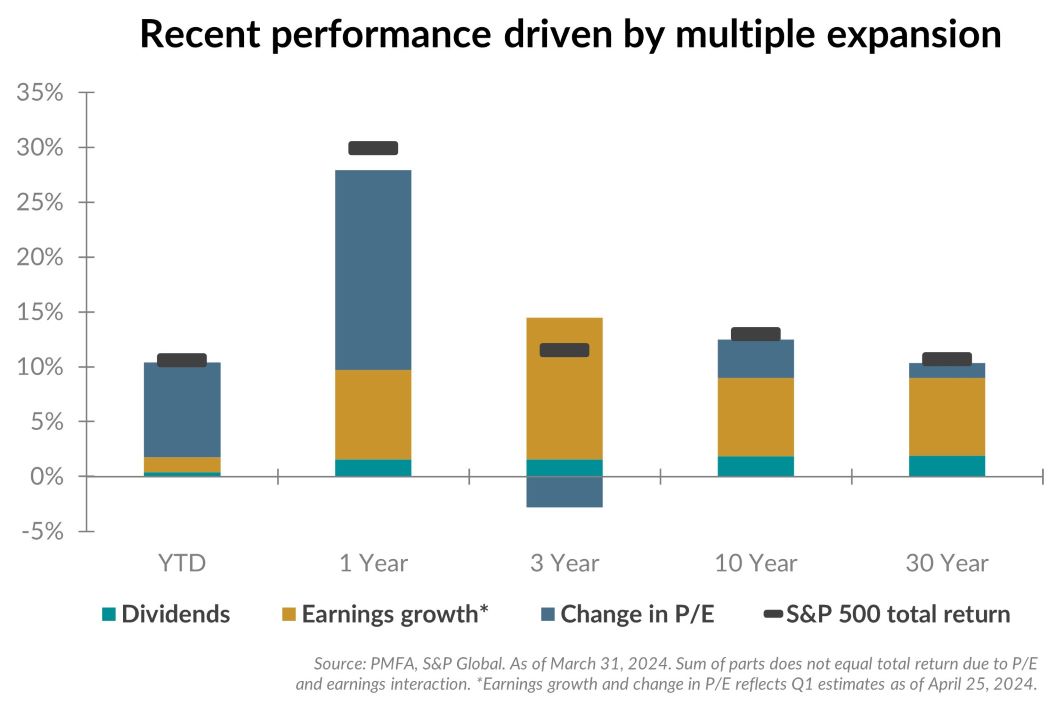
Although the drivers of short-term performance are varied, long-term stock market performance can overwhelmingly be chalked up to two primary drivers: earnings growth and dividends. Dividends have generally been a steady source of return, while earnings growth has provided the primary underpinning for the positive performance of the stock market over longer periods, as illustrated above.
A third factor tends to have a comparatively limited effect on returns over the long term but can be a considerable contributor over shorter periods. Seldom has that been more apparent in recent years than over the 12-month period ended March 31. Earnings growth was in the high single-digits over the past year, roughly in line with its 30-year average. What drove the strong return of the S&P 500 over the last 12 month? A sharp increase in the S&P 500’s valuation multiple (measured by the price/earnings or P/E ratio) accounted for almost two-thirds of the index’s gain of nearly 30% over that period.
A marked increase in the P/E multiple is often associated with an improvement in investor sentiment. As recession fears subsided, inflation receded, and the Fed announced a pause in rate hikes, a more optimistic investor mood emerged over the past year, lifting equity prices but also pushing equity valuations higher. The emerging artificial intelligence theme was a key driver as well, creating a strong tailwind for a handful of stocks that led the market through 2023.
What’s the bottom line? Earnings and dividends both positively contributed to the S&P 500’s return over the past year, but a marked improvement in investor sentiment — evidenced by a sizable expansion in the market’s P/E multiple — was a considerable driver of the return for the index.
Data sources for peer group comparisons, returns, and standard statistical data are provided by the sources referenced and are based on data obtained from recognized statistical services or other sources believed to be reliable. However, some or all of the information has not been verified prior to the analysis, and we do not make any representations as to its accuracy or completeness. Any analysis nonfactual in nature constitutes only current opinions, which are subject to change. Benchmarks or indices are included for information purposes only to reflect the current market environment; no index is a directly tradable investment. There may be instances when consultant opinions regarding any fundamental or quantitative analysis may not agree.
Plante Moran Financial Advisors (PMFA) publishes this update to convey general information about market conditions and not for the purpose of providing investment advice. Investment in any of the companies or sectors mentioned herein may not be appropriate for you. You should consult a representative from PMFA for investment advice regarding your own situation.


