
With the November election fast approaching, investors may feel a heightened level of apprehension about what it could mean for the economy and the stock market. That may naturally lead to questions such as: How might the outcome affect my portfolio? Should I change my investment strategy to prepare for potential changes in Washington, D.C.? Should I even stay invested given the uncertainty of an election year?
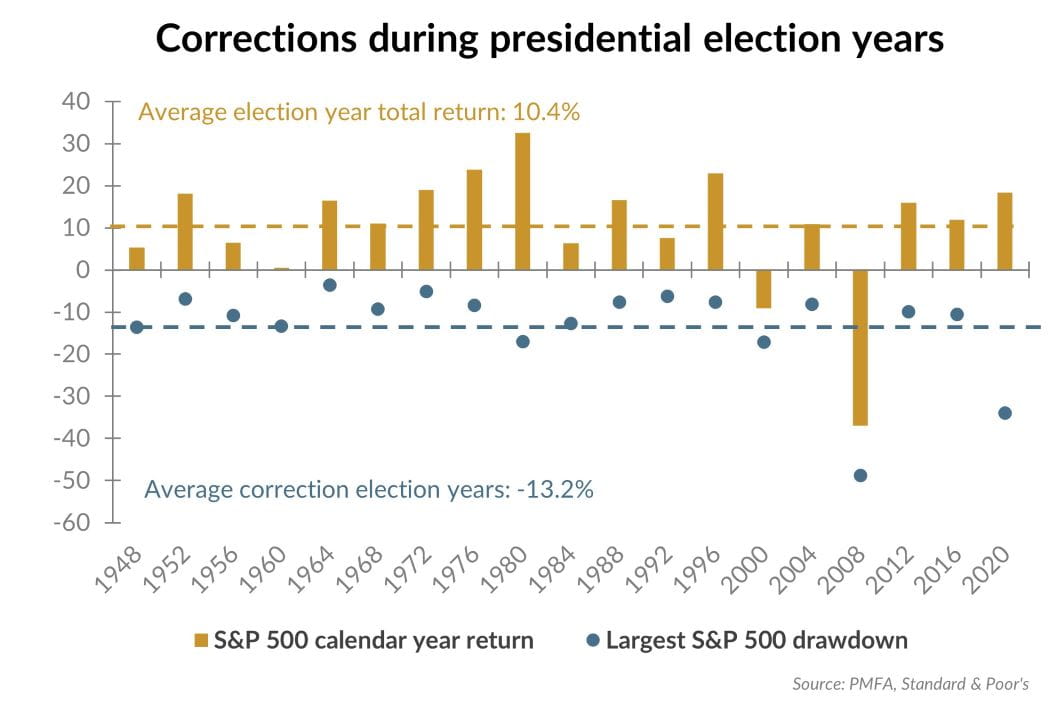
As shown in the chart above, the S&P 500 index has experienced an average drawdown of more than 13% (peak to trough) at some point during election years. That may seem significant, but it’s in line with the average intra-year decline of about 14% since 1948. That’s only part of the story though; the index has gone on to post gains of more than 10% in an average presidential election year over that period. Of course, it’s important to note that no two years are identical either in terms of volatility or outcome. Moreover, the two most severe drawdowns in election years in the post-World War II era were not election related. If anything, the negative returns associated with the global financial crisis in 2008 and the COVID-19 pandemic of 2020 likely had a greater effect on the election than vice versa. Of course, any number of events can spark equity market volatility. It’s rare that an election happens to be the primary catalyst though.
What’s the bottom line? Whether in an election year or not, volatility is part and parcel of investing in stocks. Sticking to a long-term, strategic plan through various investing and political environments has been rewarded over time, as emphasized in our associated piece. Ultimately, the economic and capital market conditions of the period, not the political context, has tended to be much more relevant as a central driver of market returns.
Data sources for peer group comparisons, returns, and standard statistical data are provided by the sources referenced and are based on data obtained from recognized statistical services or other sources believed to be reliable. However, some or all of the information has not been verified prior to the analysis, and we do not make any representations as to its accuracy or completeness. Any analysis nonfactual in nature constitutes only current opinions, which are subject to change. Benchmarks or indices are included for information purposes only to reflect the current market environment; no index is a directly tradable investment. There may be instances when consultant opinions regarding any fundamental or quantitative analysis may not agree.
Plante Moran Financial Advisors (PMFA) publishes this update to convey general information about market conditions and not for the purpose of providing investment advice. Investment in any of the companies or sectors mentioned herein may not be appropriate for you. You should consult a representative from PMFA for investment advice regarding your own situation.